GWの予定が何もない@mikedaです。だれか飲みに行きましょう。
3週間前にmuninを導入したので、今日はそこで使ってるRDS監視の仕組みを紹介します。 『munin-nodeがインストール出来ないモノをどう監視するか』という問題について、だいたい同じ感じで使えるかな。
実際のグラフ
RDSが普通にノードとして並んでいて、
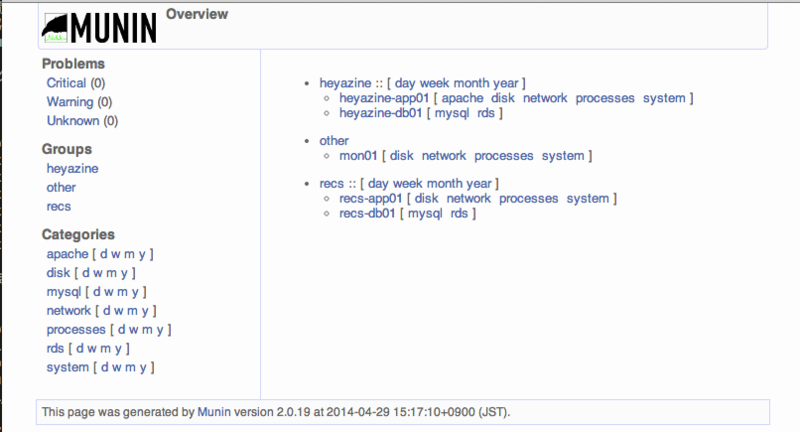
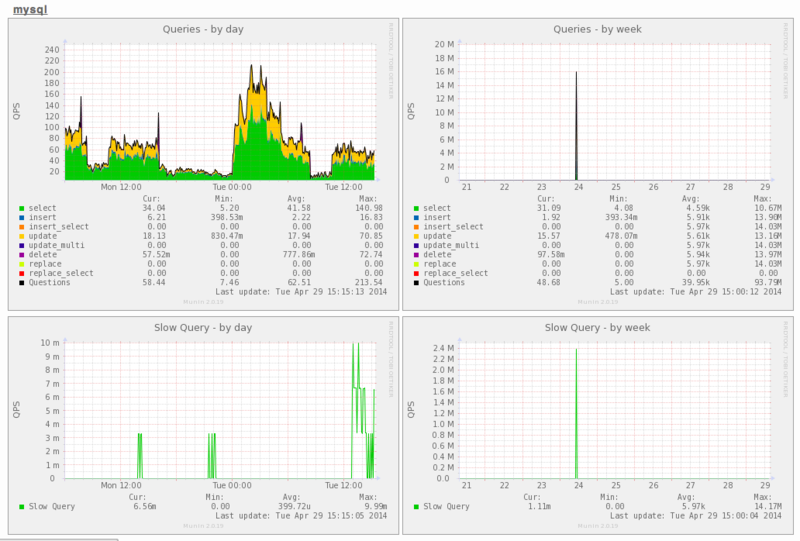
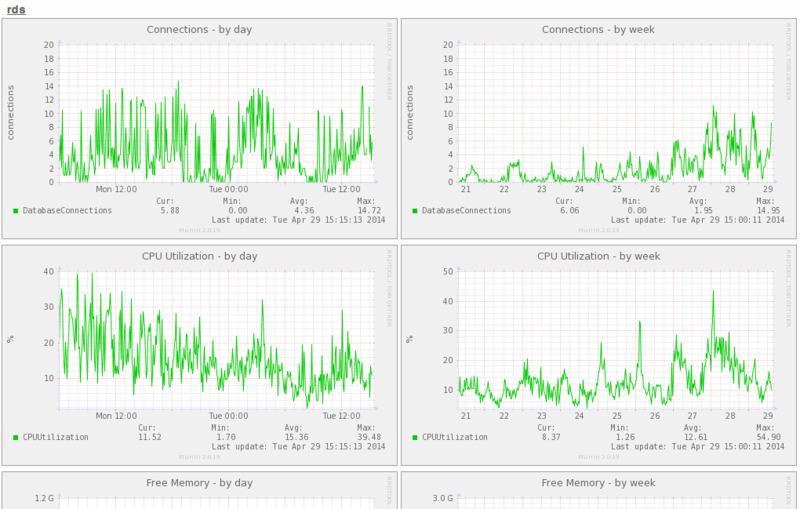
選択するとCPU使用率、クエリ数などが見れるようになってます。
では以降は細かい設定について。
muninサーバの設定
pluginの配置
[root@mon01 plugins]# pwd
/etc/munin/plugins
[root@mon01 plugins]# ll rds_*
... rds_heyazine-db01_cloudwatch -> /usr/share/munin/plugins/rds_cloudwatch
... rds_heyazine-db01_commands -> /usr/share/munin/plugins/rds_commands
... rds_heyazine-db01_slowquery -> /usr/share/munin/plugins/rds_slowquery
... rds_recs-db1_cloudwatch -> /usr/share/munin/plugins/rds_cloudwatch
... rds_recs-db1_commands -> /usr/share/munin/plugins/rds_commands
... rds_recs-db1_slowquery -> /usr/share/munin/plugins/rds_slowquery
現状の仕様だと、RDSのノード名をファイル名に含める形でシンボリックリンクを作成しています。
munin.conf
[root@mon01 ~]# cat /etc/munin/munin.conf
includedir /etc/munin/conf.d
graph_strategy cgi
cgiurl_graph /munin-cgi/munin-cgi-graph
html_strategy cron

[heyazine;]

### EC2
[heyazine;heyazine-app01]
  address 10.0.0.101
  use_node_name yes

### RDS
[heyazine;heyazine-db01]
  address 127.0.0.1
  use_node_name no

...
RDSはaddressが127.0.0.1、use_node_nameをnoに設定します。 これで、プラグインのconfig実行時に『host_name "RDS名"』を出力してやると仮想ノードが作れます。
CloudWatchを使うプラグイン
CPU使用率、空きディスク容量、空きメモリ、Latency、IOPS、などなどのグラフを作っています。
munin-runの実行結果
[root@mon01 ~]# munin-run rds_heyazine-db01_cloudwatch config
host_name heyazine-db01

multigraph rds_CPUUtilization
graph_title CPU Utilization
graph_args --base 1000
graph_vlabel %
graph_category rds
CPUUtilization.label CPUUtilization
CPUUtilization.min 0
CPUUtilization.type GAUGE

multigraph rds_FreeStorage
graph_title Free Storage
graph_args --base 1024
graph_vlabel Bytes
graph_category rds
FreeStorageSpace.label FreeStorageSpace
FreeStorageSpace.min 0
FreeStorageSpace.type GAUGE

...
[root@mon01 ~]# munin-run rds_heyazine-db01_cloudwatch
multigraph rds_CPUUtilization
CPUUtilization.value 11.97

multigraph rds_FreeStorage
FreeStorageSpace.value 97459675136.0

multigraph rds_FreeMemory
FreeableMemory.value 1017327616.0

multigraph rds_SwapUsage
SwapUsage.value 73728.0

multigraph rds_Latency
ReadLatency.value 0.0
WriteLatency.value 0.01243260417939631

multigraph rds_Throughput
ReadThroughput.value 0.0
WriteThroughput.value 1134931.0620175672

multigraph rds_IOPS
ReadIOPS.value 0.0
WriteIOPS.value 87.83457821103588

multigraph rds_Connections
DatabaseConnections.value 7.0
プラグインのコード
#!/usr/bin/ruby
require 'aws-sdk'
require 'pp'

graph_category = 'rds'
graphs = [
  { title: 'CPU Utilization', vlabel: '%',           base: 1000, metrics: %w( CPUUtilization ) },
  { title: 'Free Storage',    vlabel: 'Bytes',       base: 1024, metrics: %w( FreeStorageSpace ) },
  { title: 'Free Memory',     vlabel: 'Bytes',       base: 1024, metrics: %w( FreeableMemory ) },
  { title: 'Swap Usage',      vlabel: 'Bytes',       base: 1024, metrics: %w( SwapUsage ) },
  { title: 'Latency',         vlabel: 'sec',         base: 1000, metrics: %w( ReadLatency WriteLatency ) },
  { title: 'Throughput',      vlabel: 'bytes/sec',   base: 1000, metrics: %w( ReadThroughput WriteThroughput ) },
  { title: 'IOPS',            vlabel: 'io/s',        base: 1000, metrics: %w( ReadIOPS WriteIOPS) },
  { title: 'Connections',     vlabel: 'connections', base: 1000, metrics: %w( DatabaseConnections ) },
]

$0 =~ /rds_([^_]+)_cloudwatch$/ or exit 1
db = $1

if ARGV.shift == 'config'
  puts "host_name #{db}"
  graphs.each do |graph|
    puts "multigraph rds_#{graph[:title].delete(' ')}"
    puts "graph_title #{graph[:title]}"
    puts "graph_args --base #{graph[:base]}"
    puts "graph_vlabel #{graph[:vlabel]}"
    puts "graph_category #{graph_category}"
    graph[:metrics].each do |metric|
      puts "#{metric}.label #{metric}"
      puts "#{metric}.min 0"
      puts "#{metric}.type GAUGE"
    end
    puts ""
  end
  exit 0
end

require File.expand_path(File.dirname(File.readlink(__FILE__)) + '/aws_config')
#AWS.config(
#  access_key_id:     'XXXXXXXXXXXX',
#  secret_access_key: 'XXXXXXXXXXXX',
#  region:            'ap-northeast-1'
#)

cw = AWS::CloudWatch.new
metrics = cw.metrics.with_namespace('AWS/RDS')
            .with_dimension('DBInstanceIdentifier', db)

stats = {}
graphs.map{|g| g[:metrics]}.flatten.each do |metric|
  stats[metric] = metrics.with_metric_name(metric).first.statistics(
    :start_time => Time.now - 300,
    :end_time => Time.now,
    :statistics => ['Average']).sort_by{|s| s[:timestamp]}.last[:average]
end

graphs.each do |graph|
  puts "multigraph rds_#{graph[:title].delete(' ')}"
  graph[:metrics].each do |metric|
    puts "#{metric}.value #{stats[metric]}"
  end
  puts ""
end
multigraphというコマンドを使って、1つのプラグインで複数のグラフを作っています。 この手法はいくつかの場合に有用です。
- いっぱいシンボリックリンク作る手間を省く
- ログ集計などの重たい処理の回数を減らす
- 複数グラフを完全に同じタイミングで取得した情報から作る
- ノード毎のグラフの有無をplugin側で制御する(MySQLスレーブだけスレーブ遅延グラフ作る、Solrのコア数ぶんグラフを作る、など)
mysqlに接続してshow statusの結果を使うプラグイン
標準プラグインをゴニョって使う方法も考えたんですが、まずはクエリ数/スロークエリ数だけ見れればいいかと思ってサクッと別に作りました。 DB負荷が問題になってきたらInnoDB行読み込み数や各種キャッシュヒット率とかもグラフ化したいので、ちょっとやりかた変えるかも。
mysqlに接続するための情報はplugin設定に記載しています
[root@mon01 ~]# cat /etc/munin/plugin-conf.d/rds
[rds_heyazine-db01_*]
  env.mysqlhost     heyazine-db01.XXXXXX.ap-northeast-1.rds.amazonaws.com
  env.mysqlusername dbuser
  env.mysqlpassword XXXXXXXX
...
munin-runの実行結果
[root@mon01 ~]# munin-run rds_heyazine-db01_commands config
host_name heyazine-db01

graph_args --base 1000
graph_title Queries
graph_vlabel QPS
graph_total Questions
graph_category mysql

select.draw AREA
select.min 0
select.label select
select.type COUNTER

insert.draw STACK
insert.min 0
insert.label insert
insert.type COUNTER

...
[root@mon01 ~]# munin-run rds_heyazine-db01_commands
select.value 19360231
insert.value 957751
insert_select.value 0
update.value 8445730
update_multi.value 0
delete.value 387547
replace.value 0
replace_select.value 0
プラグインのコード
クエリ数取得プラグイン
#!/usr/bin/ruby

require 'mysql2'
require 'pp'

commands = %w( select insert insert_select update update_multi delete replace replace_select )

$0 =~ /rds_([^_]+)_\w+$/ or exit 1
db = $1

if ARGV.shift == 'config'
  puts "host_name #{db}"
  puts 'graph_args --base 1000'
  puts 'graph_title Queries'
  puts 'graph_vlabel QPS'
  puts 'graph_total Questions'
  puts 'graph_category mysql'
  commands.each.with_index do |command, i|
    puts "#{command}.draw #{i == 0 ? 'AREA' : 'STACK'}"
    puts "#{command}.min 0"
    puts "#{command}.label #{command}"
    puts "#{command}.type COUNTER"
  end
  exit 0
end

client = Mysql2::Client.new(
  host:     ENV['mysqlhost']     || 'localhost',
  username: ENV['mysqlusername'] || 'root',
  password: ENV['mysqlpassword'] || ''
)

counts = {}
client.query('SHOW GLOBAL STATUS').each do |row|
  counts[row['Variable_name']] = row['Value']
end

commands.each do |command|
  puts "#{command}.value #{counts['Com_' + command]}"
end
スロークエリ数の取得プラグイン
#!/usr/bin/ruby

require 'mysql2'
require 'pp'

$0 =~ /rds_([^_]+)_slowquery$/ or exit 1
db = $1

if ARGV.shift == 'config'
  puts "host_name #{db}"
  puts 'graph_args --base 1000'
  puts 'graph_title Slow Query'
  puts 'graph_vlabel QPS'
  puts 'graph_category mysql'
  puts "rds_slowquery.min 0"
  puts "rds_slowquery.label Slow Query"
  puts "rds_slowquery.type COUNTER"
  exit 0
end

client = Mysql2::Client.new(
  host:     ENV['mysqlhost']     || 'localhost',
  username: ENV['mysqlusername'] || 'root',
  password: ENV['mysqlpassword'] || ''
)

count = client.query("SHOW GLOBAL STATUS LIKE 'Slow_queries'").first['Value']

puts "rds_slowquery.value #{count}"
まとめ
RDSをmunin使ってこんな感じでグラフ化してますよ!という話でした。
muninはmunin-nodeをインストールできるサーバの監視はとても簡単なのですが、ELB/RDSなどの仮想ノードやネットワーク機器の監視はちょっとトリッキーで面倒くさい感じになっちゃいますね。